

TA Simplified - 5th Jan
Consider this writeup as my own diary and not as a buy/sell recommendation service

Nifty 50 - we are well-placed as of now after our last discussion on higher lows. The index is well above kep MAs of 21 and 50. Do note that we need to digest if we overeat. That is what happening in the stocks right now. We have moved so quickly that it is better if we have either a time or a price-wise correction for now. But, this is the market. We always don’t get what we desire. Therefore, I am treading cautiously now keeping stops at day low if I enter a position. The other way is I am locking a lot of gains into the strength or moving up my stop above the buy price once the stock is significantly up.
In this regard, I suggest you read Dan Zanger’s 10 Golden Rules, especially the rule no. 7 that will help you to exit a stock.
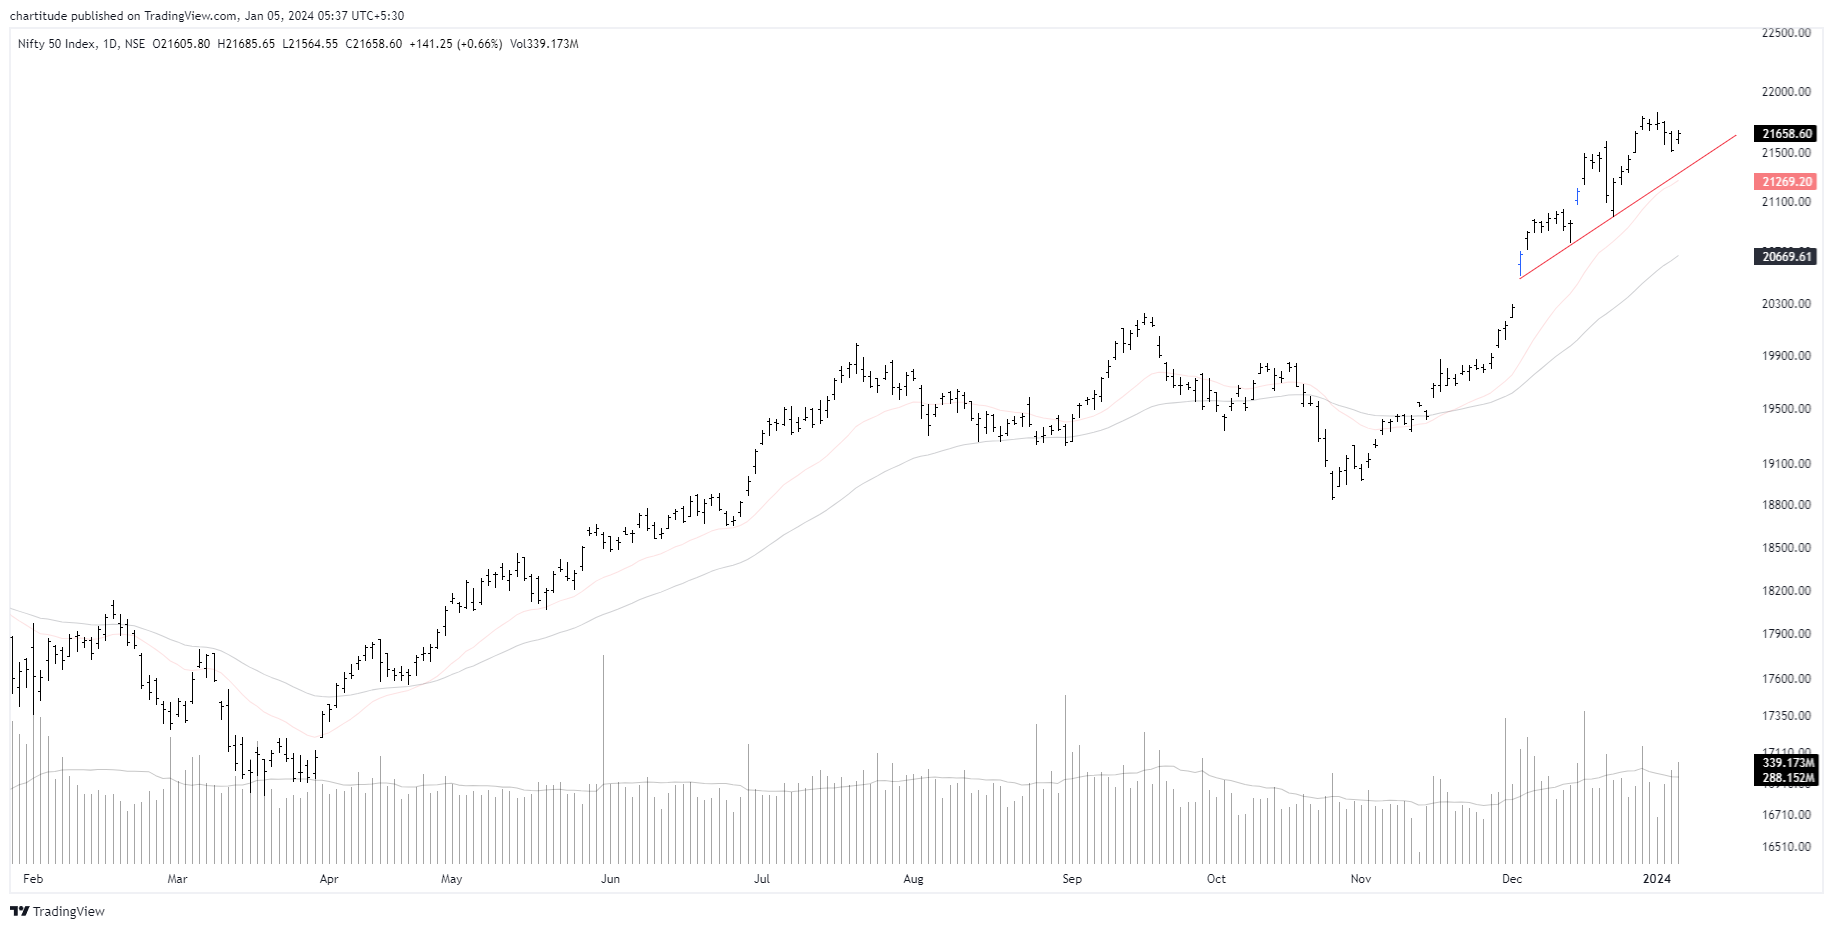

The same is the scenario for most of the indices. We are at the moment too strong post a shakeout.
Nasdaq 100: has broken the key support of 21 EMA with force. 50 MA is the next stop. Similarly, we have a lot of negative bars in most of the global indices - Kospi (Korea), Singapore 30, S&P 500, FTSE, and CAC for instance.
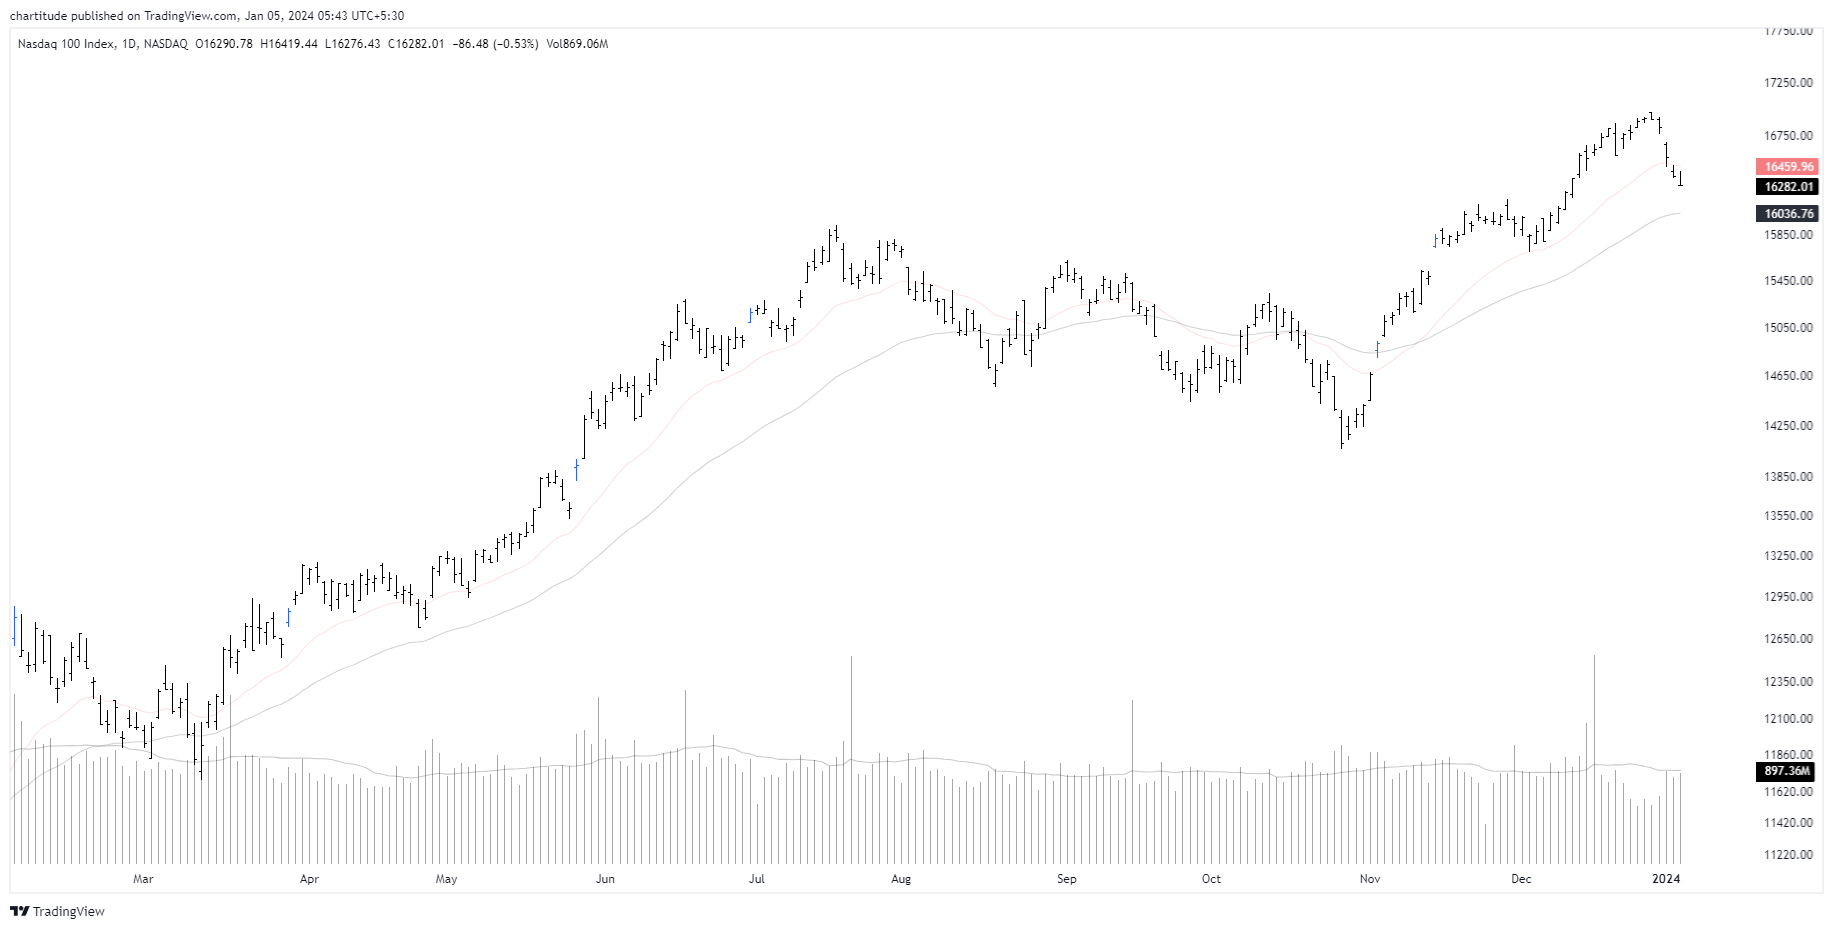
However, I have somewhere at the back of my mind also some key events that are lined up in India - budget and elections. This will be an interim budget but it is likely possible that whatever strong charts we have here are due to some event lined up ahead which has a positive impact as the market is a forward-looking mechanism.
Overall, risk management needs to be the focus area for now. We have many storng charts but the select few that I have are:
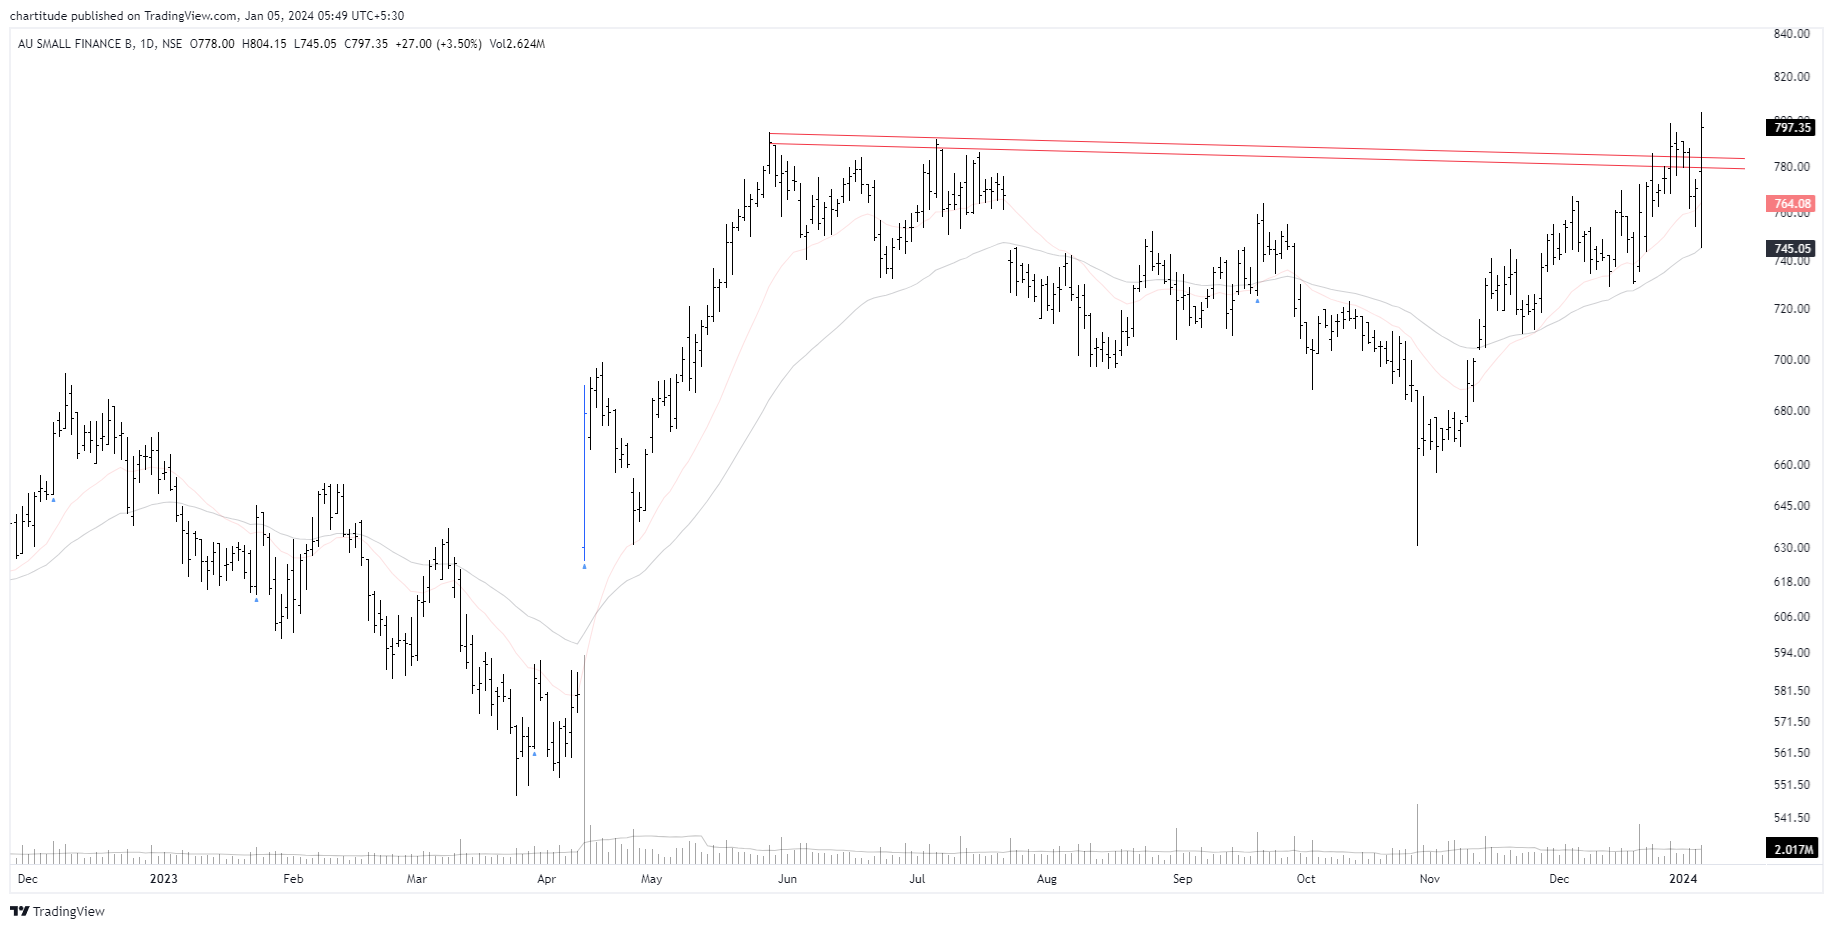
AU Bank - we discussed this and I tried my hand on this. It fell back within the range and now had a massive shakeout.
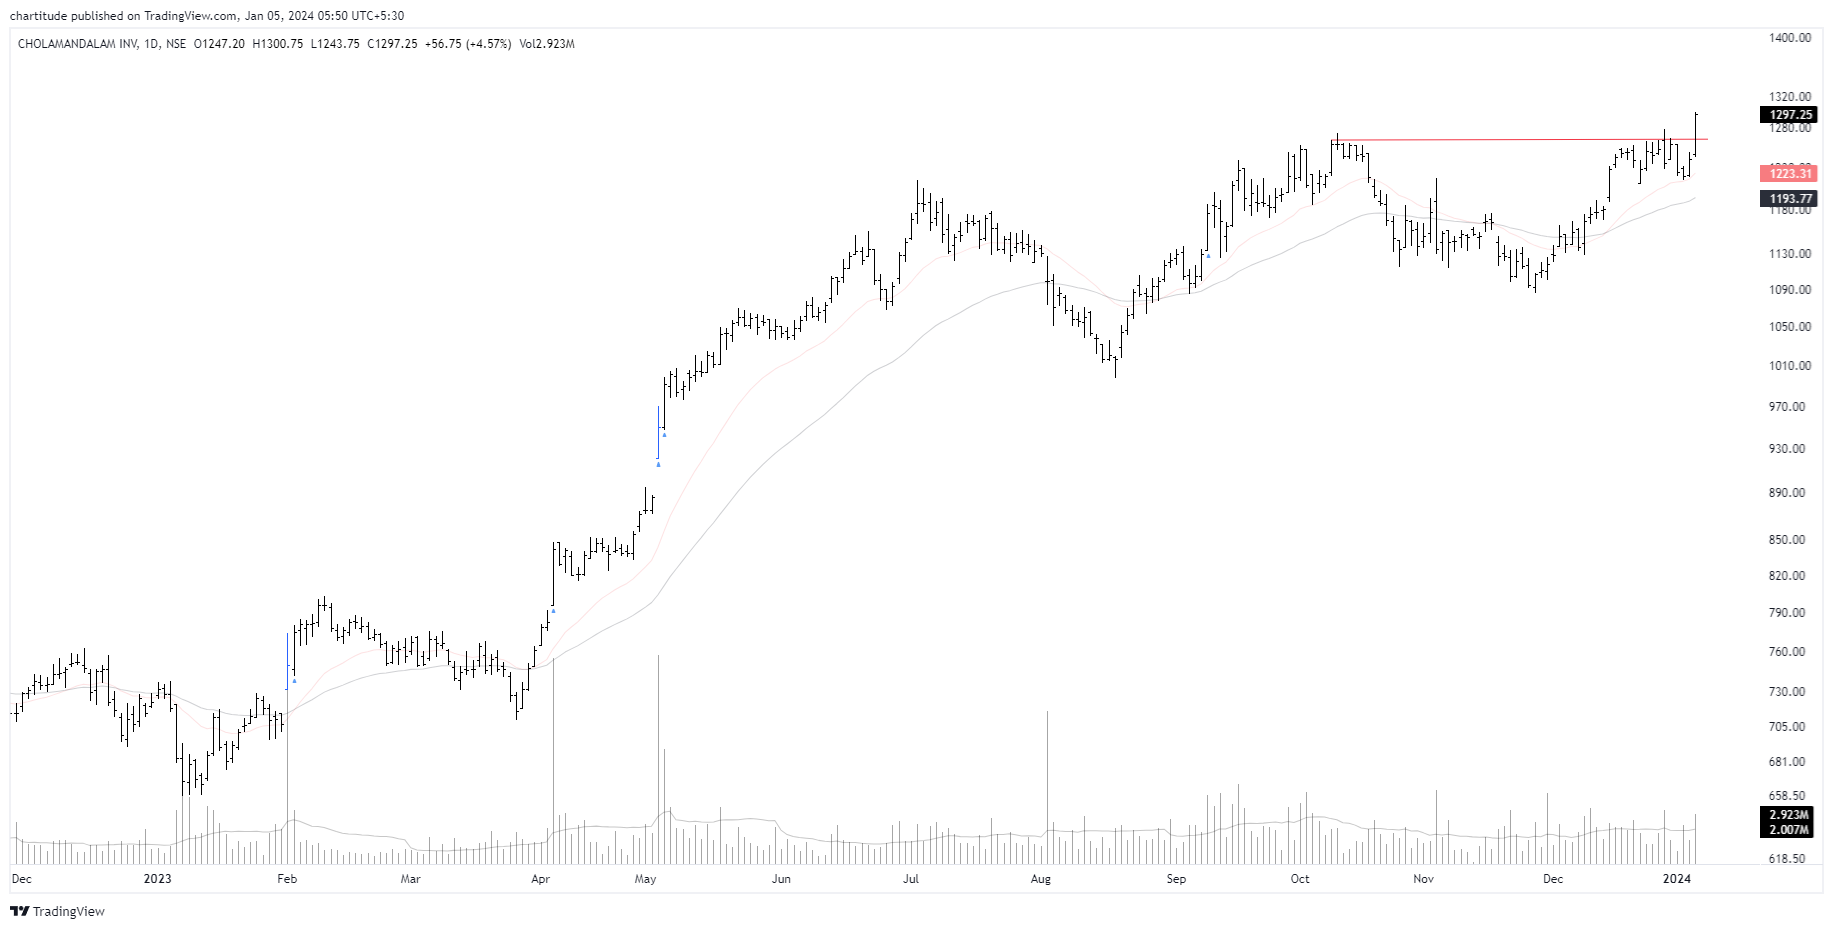
CholaFin: it is a simple horizontal line BO for now. We discussed it a couple of times before.
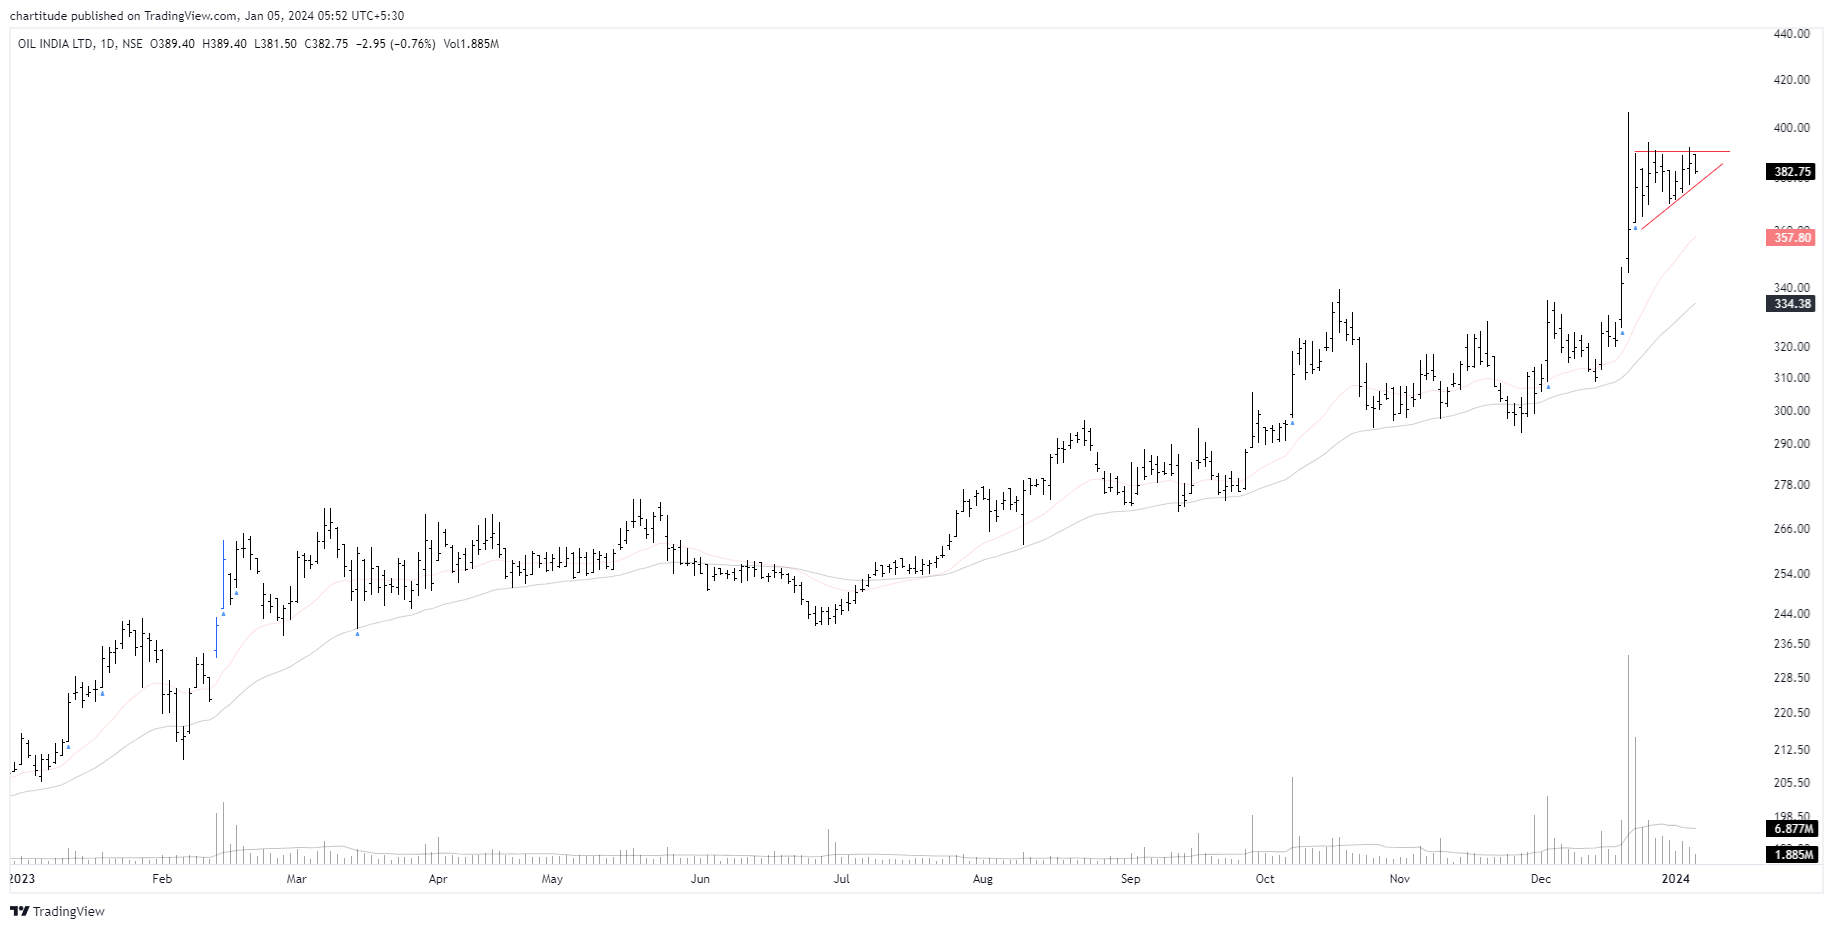
Oil India after a sharp rise is now consolidating in a pennant formation. You can read more about this chart pattern here: Pennants
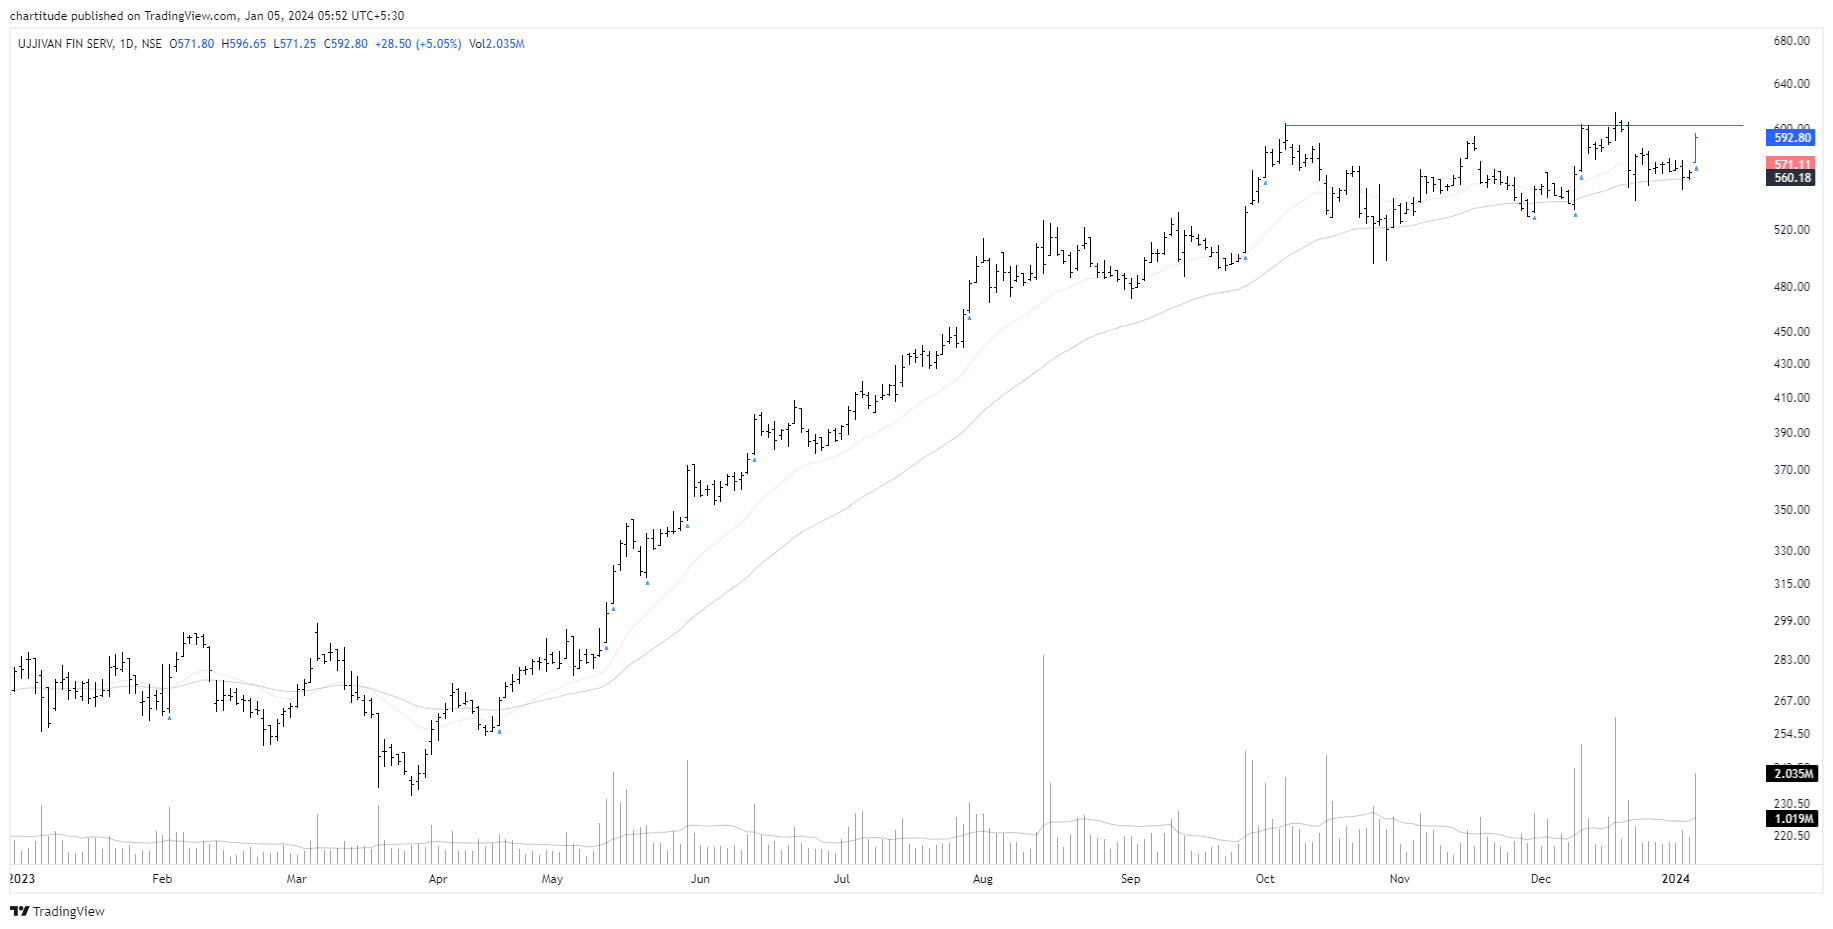
Ujjivan has a long base and a simple horizontal line setup also. For an aggressive trader, the entry was for yesterday at the gap. But, I would like it to clear that area first.
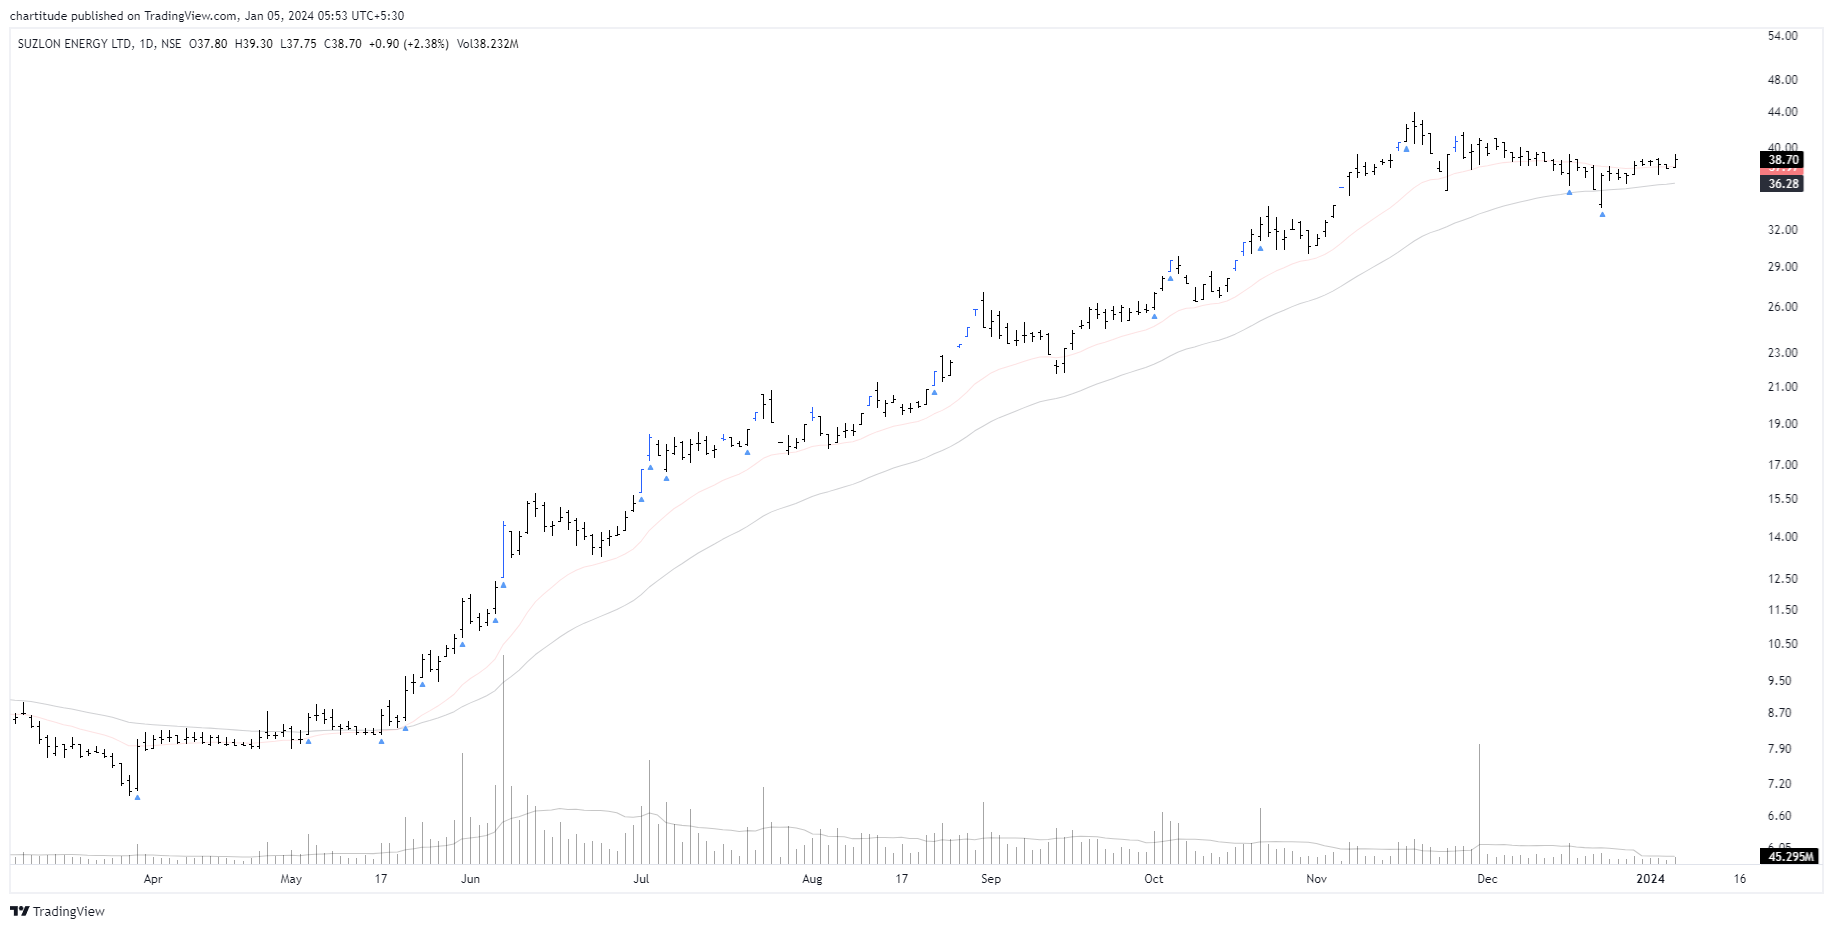
Suzlon: I am still observing for any volume spike here. Let us see
My RRG dashboard (advanced version of Relative strength) shows Energy, Oil and gas, and Real Estate to be the strongest pack so far. You can see all three in the top right quadrant which is the ‘leading’ one.
Do note: for many sectors, we do not have indices for now.

I will someday have a write-up on RRG charts to explain to you how to use them. For now, seek your permission and I will have more charts later. I have 230 charts in my reserve list. So, every day 4-5 setups look promising. Therefore, there is no place for FOMO.
The market is forever, the stocks are forever.
Thanks. I will have more for later.
Appreciate your work. This letter would help me stay away from FOMO and take the advantage of your experience in the markets before taking/offloading a position.
Thanks, is there some credible course to learn price volume action and TA . Request guide