

Are we topping out?

Nifty: this was the trendline if you remember we followed all along the way. However, this week we have a minor pattern of island reversal playing out on the chart. You can read more about the pattern here: Click here
The index had a hard landing which means the volume was also too high. Much of it is because of a poor EPS shown by a leader or what you can say perceived EPS by the leader. The level to watch out for, for now, is this trendline if this can be reclaimed today and 21 EMA that might act as a support. I am not too bullish for this scenario considering the volume shown on the index. As of today, we still have HH-HL structure playing out. The prior low is 21615 below which the first signal of loosening momentum will play out.

The question is: are we topping out? Now, that is where I have always mentioned that no one knows if this is merely a pullback in an uptrend or the start of a classic correction. The best way to play with this question is to have a stop if you are a trader. You will eventually be thrown out of your bets. The best way is to stick with the stronger stocks if you are already holding them. This is the best time to spot the actions of the leaders.
I wrote in a WhatsApp group a couple of weeks before that I am not comfortable with leaders stalling near the highs. Where do you check them? The best is to download the list of all the F&O stocks. At least, they are the leaders to some extent in their respective sectors.
How to spot the stronger stocks? They will be the ones that go unaffected by this fall. So, you have to use any software to pick a tool of Relative Strength and spot those names that are standing tall. I will write more on Relative Strength someday later for sure.
You can check the charts of IRFC, Electrosteel Castings, PTC India, RVNL, and Cochin Shipyard as an example to see how these stronger names appear. Not a buy recommendation for sure.
What am I doing is not buying any new name for now. I am just focusing on the stocks that I am holding. I am quick to sell a loser even before my stop is hit. I am trimming at least the losers by half. Risk management is the number 1 priority and for you too, it should be the one. If you have capital left, you can grow it anytime.
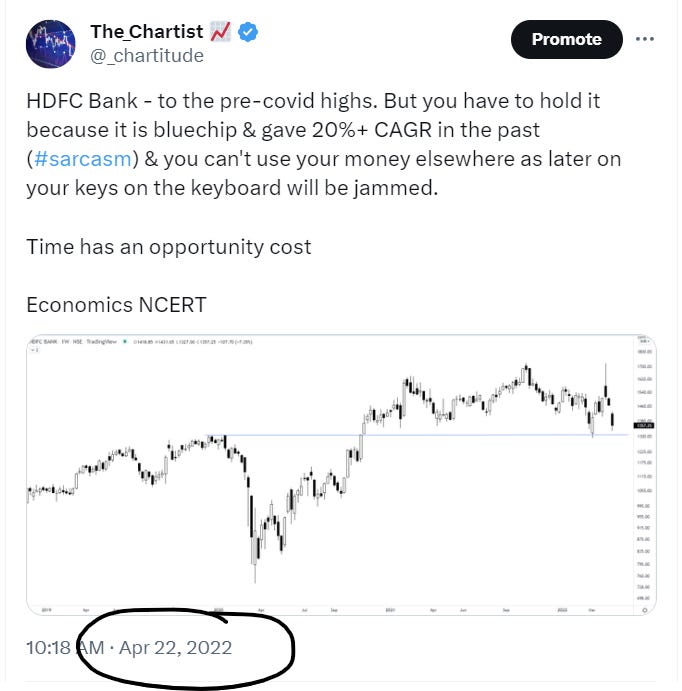
HDFC Bank: Case study

I have mentioned multiple times that even if you are a fundamental investor, you need to discard Technical Analysis as some sort of black magic. What will you do after researching a company? Buy it. Once a big buyer gets in, the same is visible on the chart with the price moving up on higher volumes. So, this stock has done nothing since October 2021. You will ask me how in October 2021 - someone will know the future. As I am holding it the chart is good. True.
That is why we have a concept of “time-stop” in Technical analysis. No book mentions the exact number of weeks you can hold your position if it does nothing. But for me, 6 months is a fair number above which one should think of at least trimming the non-performing bet in an investment. Now, what suits you may be different. But, we need a thought on this. As we all do not hold just one stock it might be possible that we can use this unlocked money in another moving name. That is where the power of TA comes into the picture. We knew the level of HDFCB at 1750, so we set a price alert and return if it crosses this level.
Overall, we will have a detailed note on many things as we move forward. I will have more for later.
Thanks
Opportunity cost matters for everyone, be it fundamental or TA.
Splendid job
Superb